animation 套件可以建立動畫檔案, 例: GIF 等檔案, 本篇文章說明使用方法.
# end
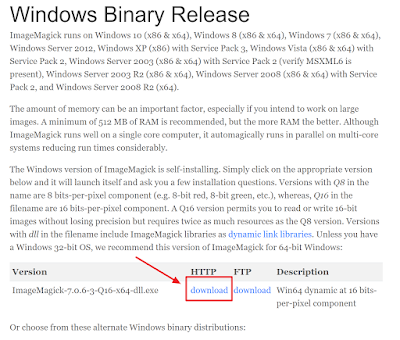
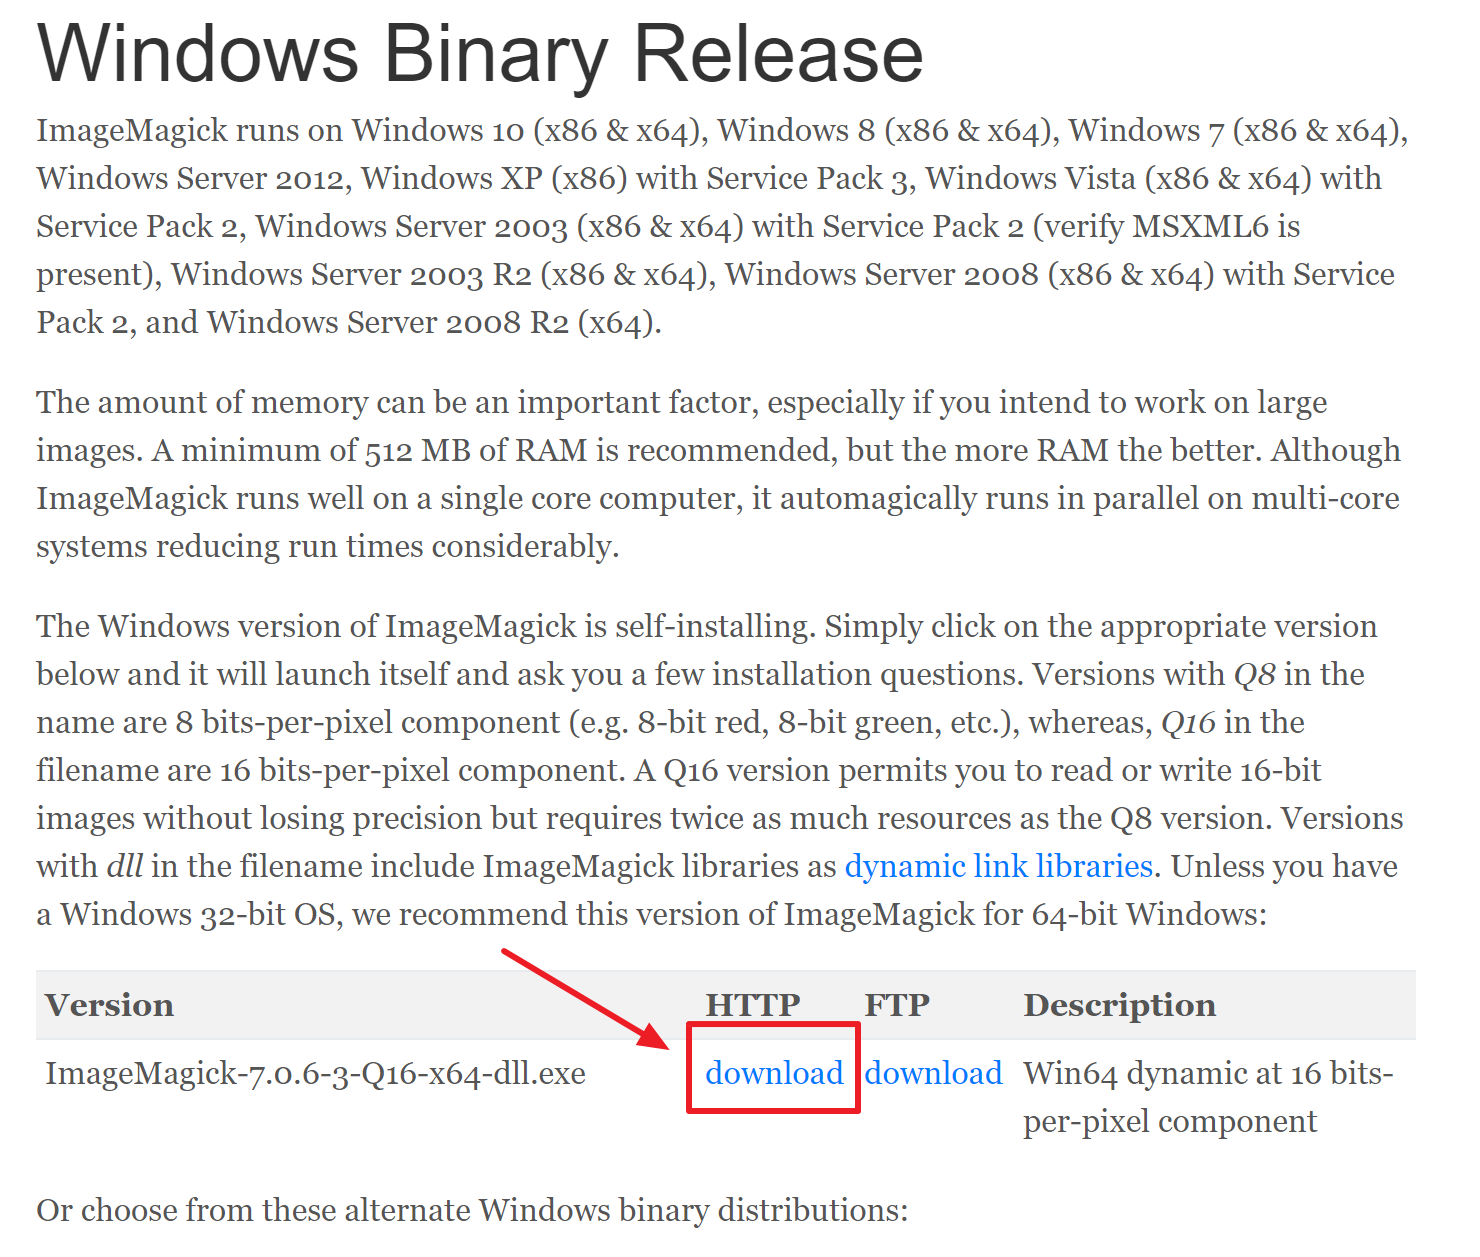
下載 ImageMagick 軟體
下載位置 https://www.imagemagick.org/script/download.php , 下載網頁包括 Unix Binary Release, Mac OS X Binary Release, iOS Binary Release 以及 Windows Binary Release, 在 Windows 版本中直接選取 "mageMagick-7.0.6-3-Q16-x64-dll.exe" 下載即可.
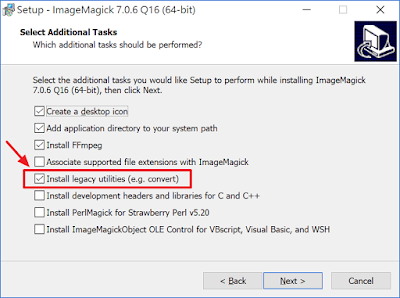
安裝 ImageMagick 軟體
ImageMagick安裝過程中, 因為 animation 套件須使用 convert 等方法, 因此在 [Select Additional Tasks] 視窗中記得要勾選 Install legacy utilities(e.g. convert), 按 Next 完成安裝.

安裝 animation 套件
install.packages("animation")
範例1
將要繪圖的函數建立在 saveGIF( ) 函數之中. movie.name 參數可設定匯出GIF檔案名稱.
# install.packages("animation")
library(animation)

# example 1
saveGIF({
  for (i in 1:10) plot(runif(10), ylim = 0:1, col=i)
},  movie.name = "animation_runif.gif")
範例2
# example 2
# reference: http://www.programmingr.com/content/animations-r/

# Set delay between frames when replaying
ani.options(interval=.05)

# Set up a vector of colors for use below
col.range <- heat.colors(15)

# Begin animation loop
# Note the brackets within the parentheses
saveGIF({

 # For the most part, it’s safest to start with graphical settings in
 # the animation loop, as the loop adds a layer of complexity to
 # manipulating the graphs. For example, the layout specification needs to
 # be within animation loop to work properly.
 layout(matrix(c(1, rep(2, 5)), 6, 1))

 # Adjust the margins a little
 par(mar=c(4,4,2,1) + 0.1)

 # Begin the loop that creates the 150 individual graphs
 for (i in 1:150) {

 # Pull 100 observations from a normal distribution
 # and add a constant based on the iteration to move the distribution
 chunk <- rnorm(100)+sqrt(abs((i)-51))

 # Reset the color of the top chart every time (so that it doesn’t change as the
 # bottom chart changes)
 par(fg=1)

 # Set up the top chart that keeps track of the current frame/iteration
 # Dress it up a little just for fun
 plot(-5, xlim = c(1,150), ylim = c(0, .3), axes = F, xlab = "", ylab = "", main = "Iteration demo")
 abline(v=i, lwd=5, col = rgb(0, 0, 255, 255, maxColorValue=255))
 abline(v=i-1, lwd=5, col = rgb(0, 0, 255, 50, maxColorValue=255))
 abline(v=i-2, lwd=5, col = rgb(0, 0, 255, 25, maxColorValue=255))

 # Bring back the X axis
 axis(1)

 # Set the color of the bottom chart based on the distance of the distribution’s mean from 0
 par(fg = col.range[mean(chunk)+3])

 # Set up the bottom chart
 plot(density(chunk), main = "", xlab = "X Value", xlim = c(-5, 15), ylim = c(0, .6))

 # Add a line that indicates the mean of the distribution. Add additional lines to track
 # previous means
 abline(v=mean(chunk), col = rgb(255, 0, 0, 255, maxColorValue=255))
 if (exists("lastmean")) {abline(v=lastmean, col = rgb(255, 0, 0, 50, maxColorValue=255)); prevlastmean <- lastmean;}
 if (exists("prevlastmean")) {abline(v=prevlastmean, col = rgb(255, 0, 0, 25, maxColorValue=255))}
 #Fix last mean calculation
 lastmean <- mean(chunk)
 }
}, movie.name = "animation_iteration.gif")
# end
PREVIOUS函數原始碼 source code