本篇文章說明如何在 Tableau 軟體中使用 R 語言建立模型,以提供決策支援.
# Tableau
# R
# Rserve 套件
# Clustering
# kmeans
參考資料:
https://github.com/rwepa/tableaur
1. 下載並安裝 Tableau 14天版本
https://www.tableau.com/products/trial
2. 下載並安裝 R語言/RStudio軟體
https://www.r-project.org/
https://www.rstudio.com/products/rstudio/download/#download
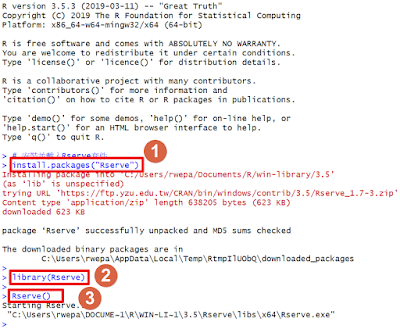
3. 安裝 Rserve 套件, 安裝套件僅需安裝一次即可.
install.packages("Rserve")
4. 載入 Rserve 套件
library(Rserve)
5. 啟動 Rserve 套件
Rserve()
參考下圖安裝與執行結果. 每次使用皆須完成此設定.
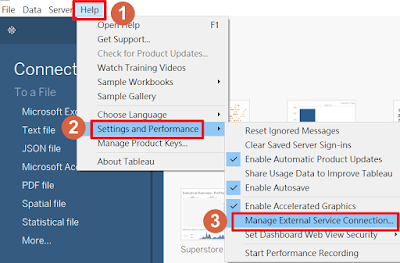
6. 設定 Tableau 與 R 連結
Tableau \ Help \ Settings and Performance \ Manage External Service Connection
8. Tableau 視窗會顯示 Successfully connected to the external service. 表示Tableau 與 R 連接成功. 注意: 每次啟動Tableau 連結 R 皆須進行設定.
# Tableau
# R
# Rserve 套件
# Clustering
# kmeans
參考資料:
https://github.com/rwepa/tableaur
1. 下載並安裝 Tableau 14天版本
https://www.tableau.com/products/trial
2. 下載並安裝 R語言/RStudio軟體
https://www.r-project.org/
https://www.rstudio.com/products/rstudio/download/#download
3. 安裝 Rserve 套件, 安裝套件僅需安裝一次即可.
install.packages("Rserve")
4. 載入 Rserve 套件
library(Rserve)
5. 啟動 Rserve 套件
Rserve()
參考下圖安裝與執行結果. 每次使用皆須完成此設定.
6. 設定 Tableau 與 R 連結
Tableau \ Help \ Settings and Performance \ Manage External Service Connection
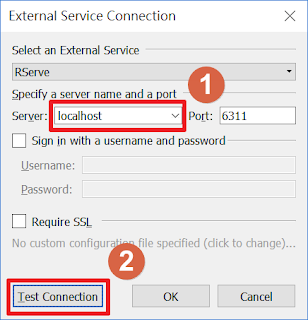
7. External Service Connection 視窗 \ Server 選項點選 localhost \ 按 Test Connection.
8. Tableau 視窗會顯示 Successfully connected to the external service. 表示Tableau 與 R 連接成功. 注意: 每次啟動Tableau 連結 R 皆須進行設定.
9. 將 iris 資料集匯出成 iris.csv 以提供 Tableau 匯入資料.
RStudio輸入 write.table(iris, file="iris.csv", sep=",", row.names=FALSE)
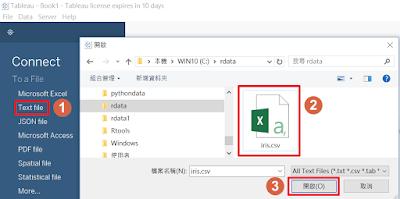
10. Tableau 匯入 iris.csv.
Tableau \ Connect \ Text file \ iris.csv \ 開啟
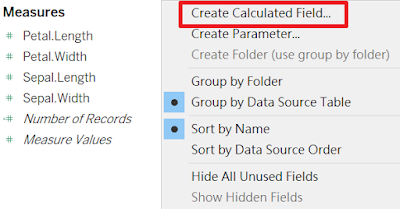
11. 選取 Sheet1 \ Measures 空白處 \ 右鍵 \ Create Calculated Field
12. Create Calculated Field 視窗 \ 名稱改為 集群 新增以下內容
SCRIPT_INT('set.seed(168);
result <- kmeans(data.frame(.arg1,.arg2,.arg3,.arg4), 3);
result$cluster;',
SUM([Sepal.Length]),SUM([Sepal.Width]),SUM([Petal.Length]),SUM([Petal.Width]))
- 本例使用集群 kmeans 演算法. result為kmeans 演算法的計算結果. result$cluster 回傳是集群整數編號, 因此使用 SCRIPT_INT 整數 Tableau 函數.
- 黃色 R 程式以 ' ' 標註, 三行R程式以 ; 區隔.
- 四個欄位名稱以SUM函數表示, 中間以 , 區隔.
13. 選取 集群 \ 右鍵 \ Convert to Discrete 將資料轉換為離散型變數.
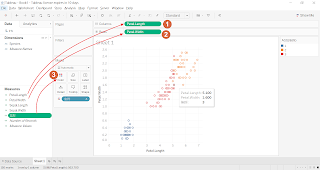
14. 建立視覺化集群結果.
- 將 Petal.Length 拖曳至 Columns
- 將 Petal.Width 拖曳至 Rows
- 將 集群 拖曳至 Color
# end
PREVIOUSntuthesis:用 Markdown 撰寫博碩士論文
NEXTR軟體開放資料應用-高速公路篇
